New visualization function tutorial#
[1]:
import healpy as hp
from healpy.newvisufunc import projview, newprojplot
[2]:
import matplotlib.pyplot as plt
import numpy as np
[3]:
m = hp.read_map(
    "../test/data/wmap_band_iqumap_r9_7yr_W_v4_udgraded32_masked_smoothed10deg_fortran.fits"
);
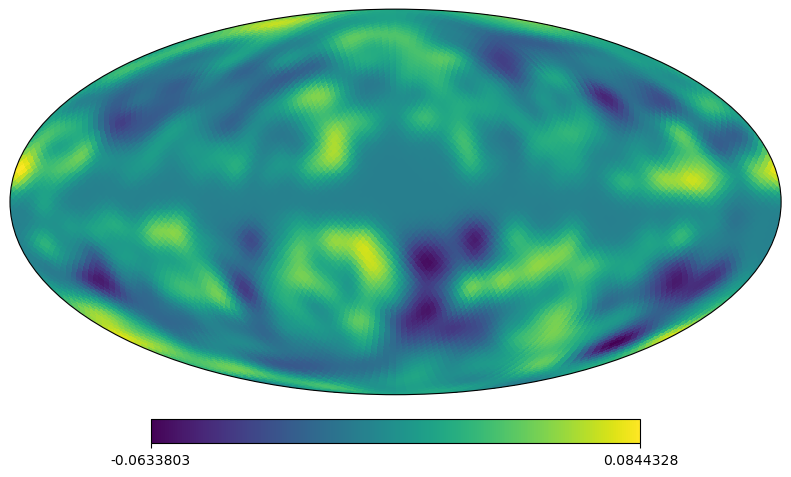
[4]:
# classic healpy mollweide projections plot
# other matplotlib projections are possible, such as: "aitoff","hammer",lambert"
projview(m, coord=["G"], flip="astro", projection_type="mollweide");
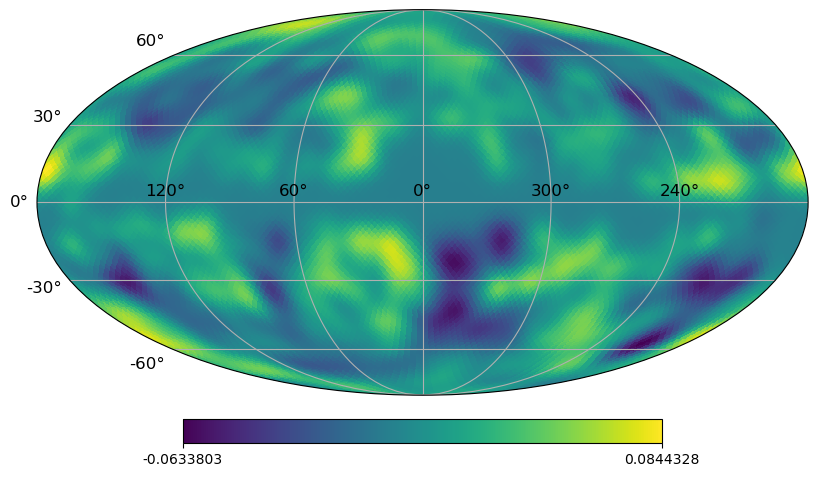
[5]:
# classic healpy mollweide projections plot with graticule
projview(
    m, coord=["G"], graticule=True, graticule_labels=True, projection_type="mollweide"
);
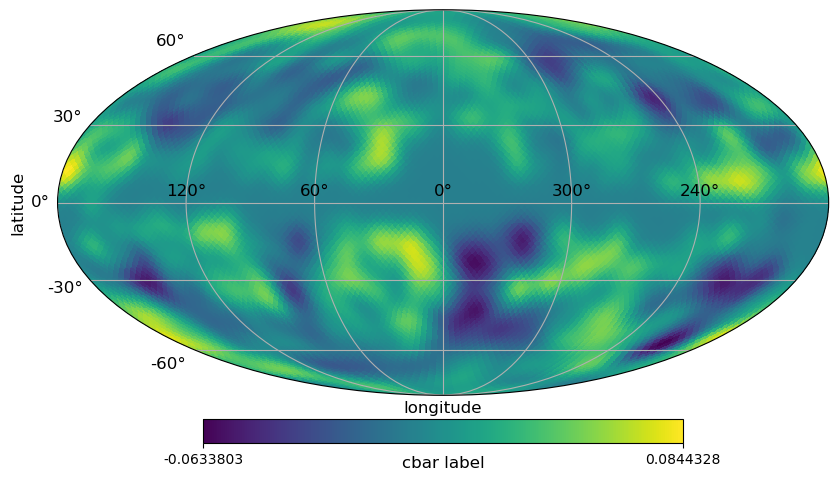
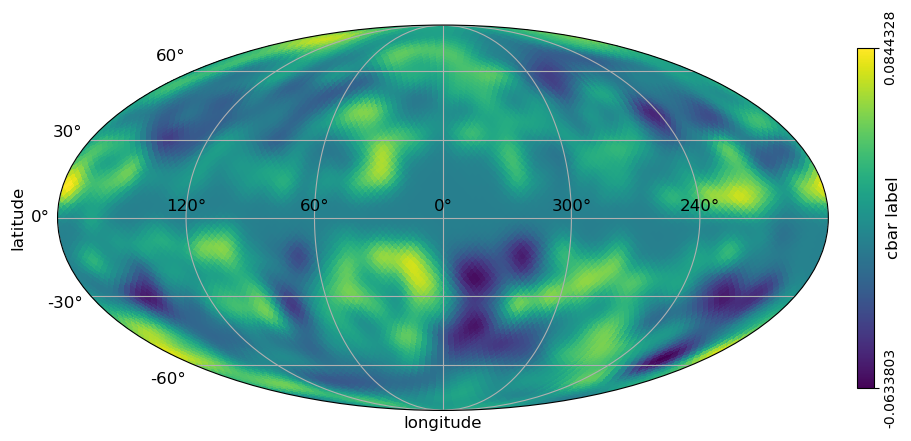
[6]:
# classic healpy mollweide projections plot with graticule and axis labels
projview(
    m,
    coord=["G"],
    graticule=True,
    graticule_labels=True,
    unit="cbar label",
    xlabel="longitude",
    ylabel="latitude",
    cb_orientation="horizontal",
    projection_type="mollweide",
);
[7]:
# classic healpy mollweide projections plot with graticule and axis labels and vertical color bar
projview(
    m,
    coord=["G"],
    graticule=True,
    graticule_labels=True,
    unit="cbar label",
    xlabel="longitude",
    ylabel="latitude",
    cb_orientation="vertical",
    projection_type="mollweide",
)
[7]:
<matplotlib.collections.QuadMesh at 0x7447f1f32930>
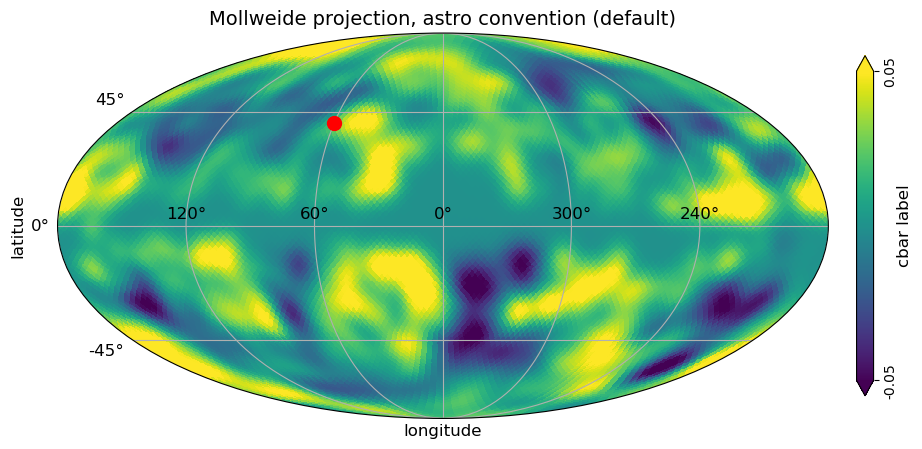
[8]:
# classic healpy mollweide projections plot with graticule and axis labels and vertical color bar, when min and max is set
# to be different than the min, max of the data, the colorbar is extended
# with title
projview(
    m,
    coord=["G"],
    graticule=True,
    graticule_labels=True,
    unit="cbar label",
    xlabel="longitude",
    ylabel="latitude",
    cb_orientation="vertical",
    min=-0.05,
    max=0.05,
    latitude_grid_spacing=45,
    projection_type="mollweide",
    title="Mollweide projection, astro convention (default)",
);
newprojplot(theta=np.radians(50), phi=np.radians(60), marker="o", color="r", markersize=10);
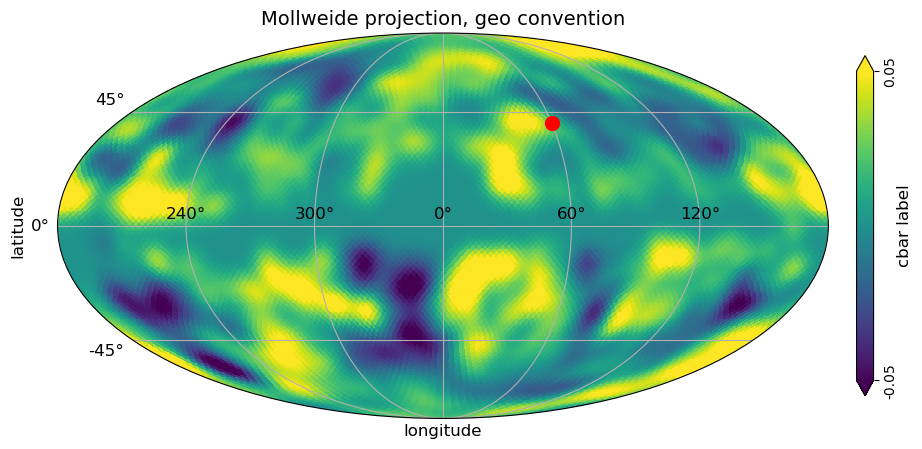
[9]:
# classic healpy mollweide projections plot with graticule and axis labels and vertical color bar, when min and max is set
# to be different than the min, max of the data, the colorbar is extended
# with title, GEO convention for longitude
projview(
    m,
    coord=["G"],
    graticule=True,
    graticule_labels=True,
    unit="cbar label",
    xlabel="longitude",
    ylabel="latitude",
    cb_orientation="vertical",
    min=-0.05,
    max=0.05,
    latitude_grid_spacing=45,
    projection_type="mollweide",
    title="Mollweide projection, geo convention",
    flip="geo",
    phi_convention="clockwise"
);
# newprojplot knows about the flip in plotting longitude
newprojplot(theta=np.radians(50), phi=np.radians(60), marker="o", color="r", markersize=10);
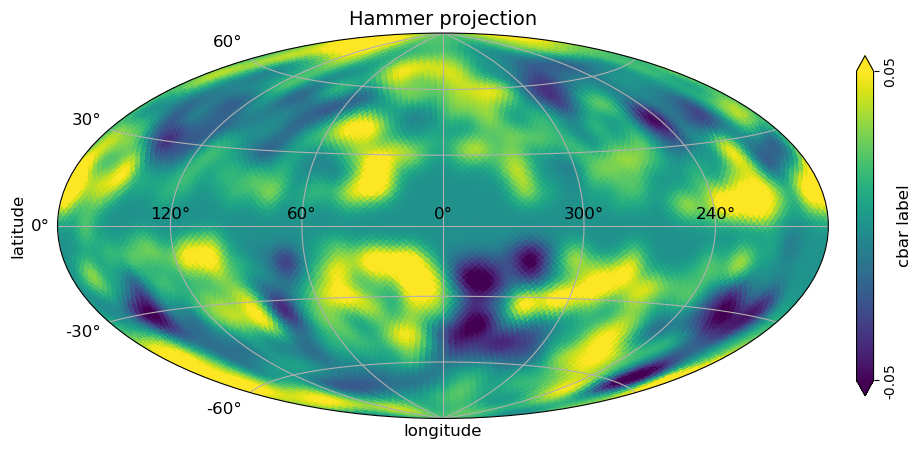
[10]:
# hammer view plot with graticule and axis labels and vertical color bar, when min and max is set
# to be different than the min, max of the data, the colorbar is extended
projview(
    m,
    coord=["G"],
    graticule=True,
    graticule_labels=True,
    unit="cbar label",
    xlabel="longitude",
    ylabel="latitude",
    cb_orientation="vertical",
    min=-0.05,
    max=0.05,
    latitude_grid_spacing=30,
    projection_type="hammer",
    title="Hammer projection",
);
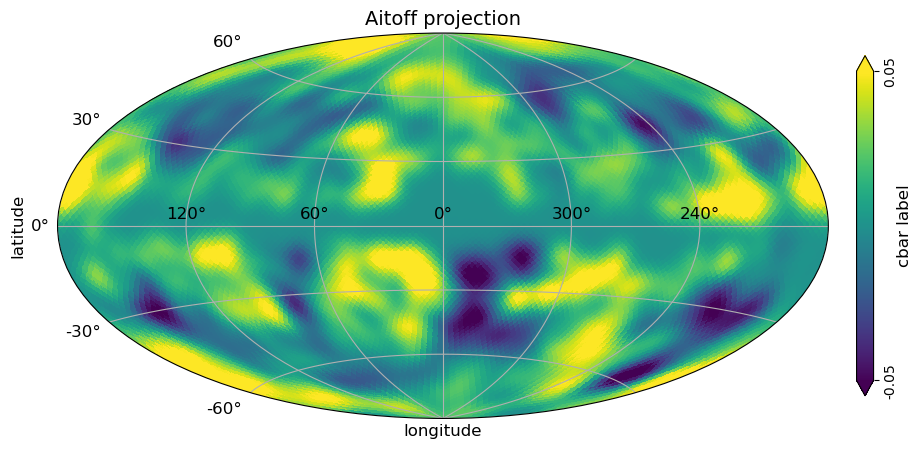
[11]:
# aitoff view plot with graticule and axis labels and vertical color bar, when min and max is set
# to be different than the min, max of the data, the colorbar is extended
projview(
    m,
    coord=["G"],
    graticule=True,
    graticule_labels=True,
    unit="cbar label",
    xlabel="longitude",
    ylabel="latitude",
    cb_orientation="vertical",
    min=-0.05,
    max=0.05,
    latitude_grid_spacing=30,
    projection_type="aitoff",
    title="Aitoff projection",
);
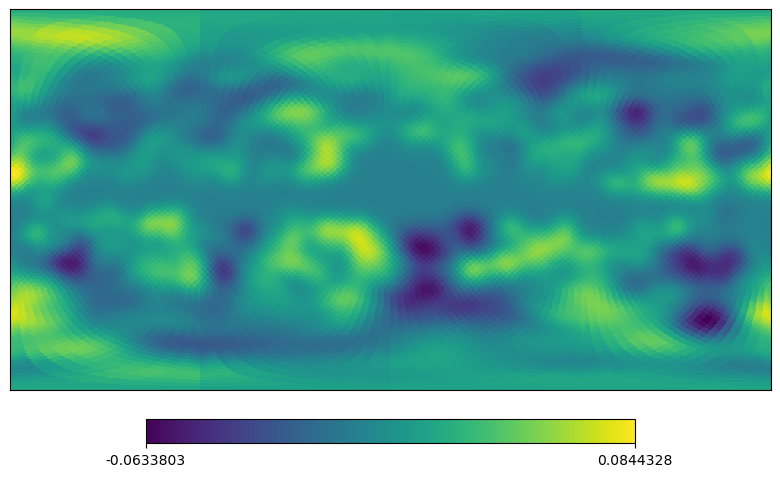
[12]:
# equivalent to cartview in classic healpy
projview(m, coord=["G"], projection_type="cart");
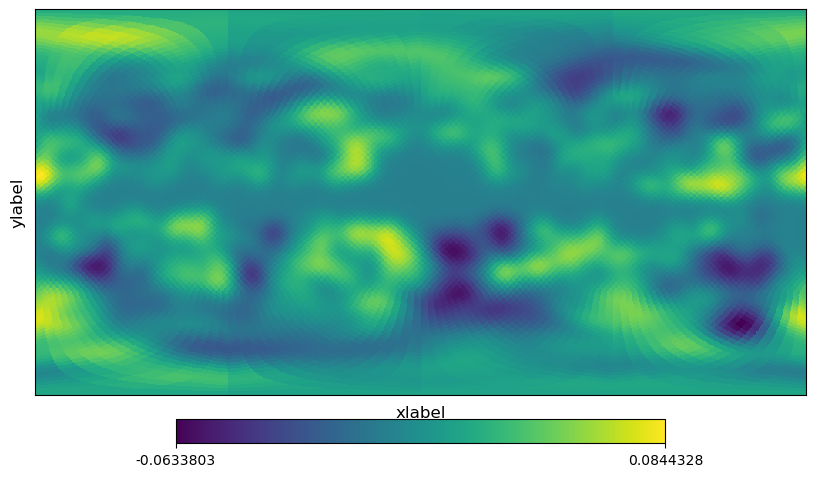
[13]:
# equivalent to cartview
projview(m, coord=["G"], projection_type="cart", xlabel="xlabel", ylabel="ylabel");
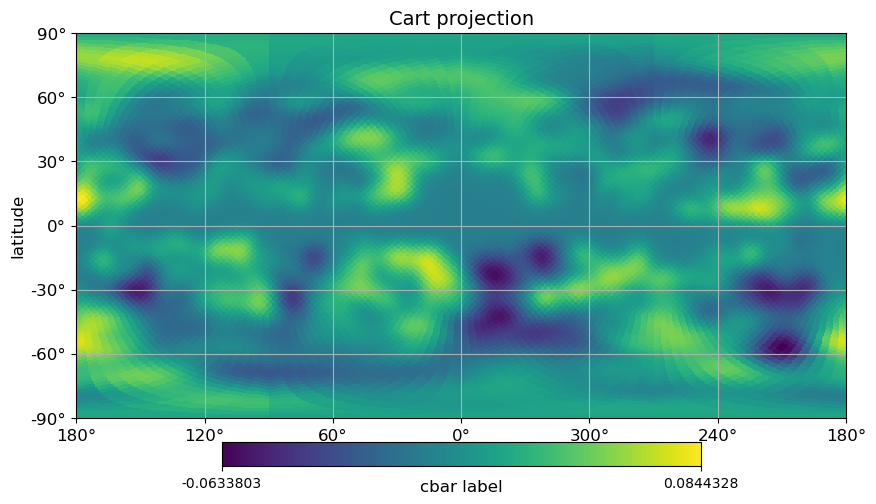
[14]:
# cartview, with labels and graticule
projview(
    m,
    coord=["G"],
    graticule=True,
    graticule_labels=True,
    unit="cbar label",
    xlabel="longitude",
    ylabel="latitude",
    cb_orientation="horizontal",
    projection_type="cart",
    title="Cart projection",
);
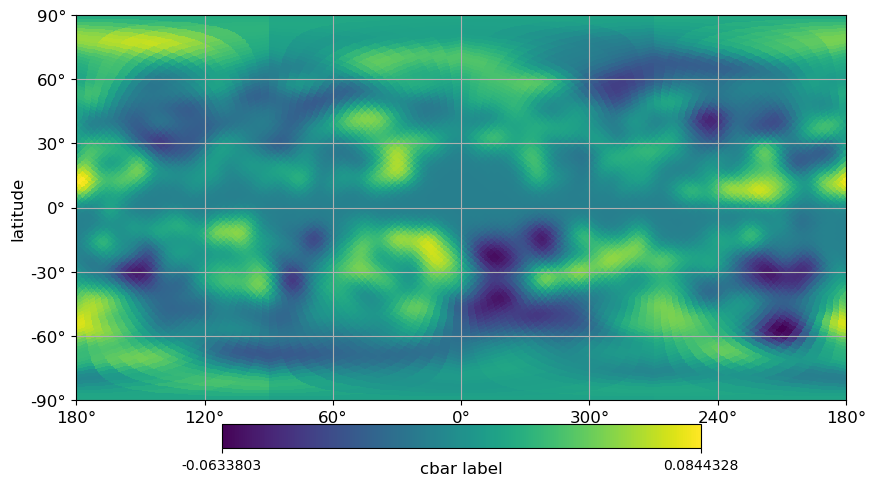
[15]:
# cartview, with labels and graticule
projview(
    m,
    coord=["G"],
    graticule=True,
    graticule_labels=True,
    unit="cbar label",
    xlabel="longitude",
    ylabel="latitude",
    cb_orientation="horizontal",
    projection_type="cart",
);
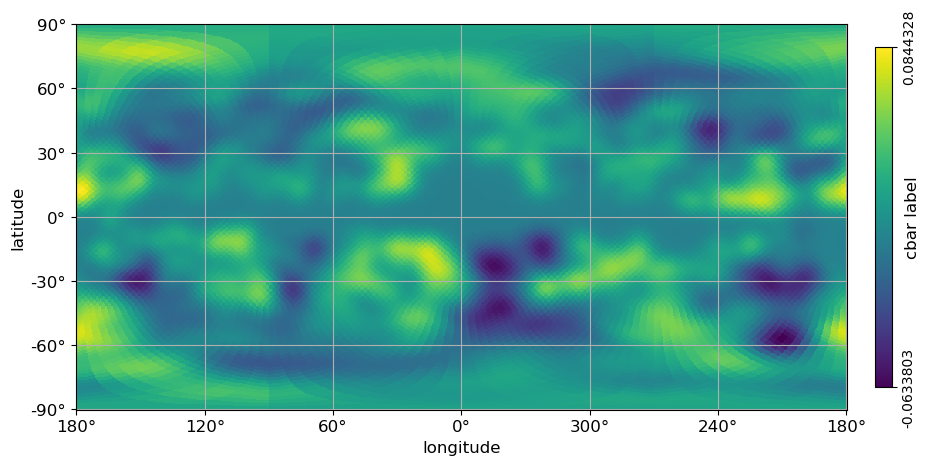
[16]:
# cartview, with labels and graticule, vertical cbar
projview(
    m,
    coord=["G"],
    graticule=True,
    graticule_labels=True,
    unit="cbar label",
    xlabel="longitude",
    ylabel="latitude",
    cb_orientation="vertical",
    projection_type="cart",
);
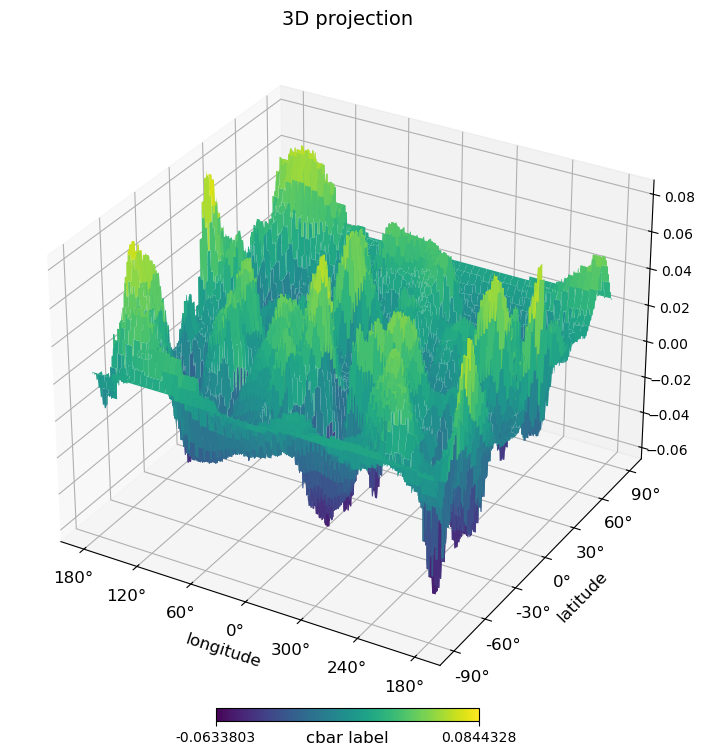
[17]:
# 3d view
projview(
    m,
    coord=["G"],
    hold=False,
    graticule=True,
    graticule_labels=True,
    unit="cbar label",
    xlabel="longitude",
    ylabel="latitude",
    cb_orientation="horizontal",
    projection_type="3d",
    title="3D projection",
);
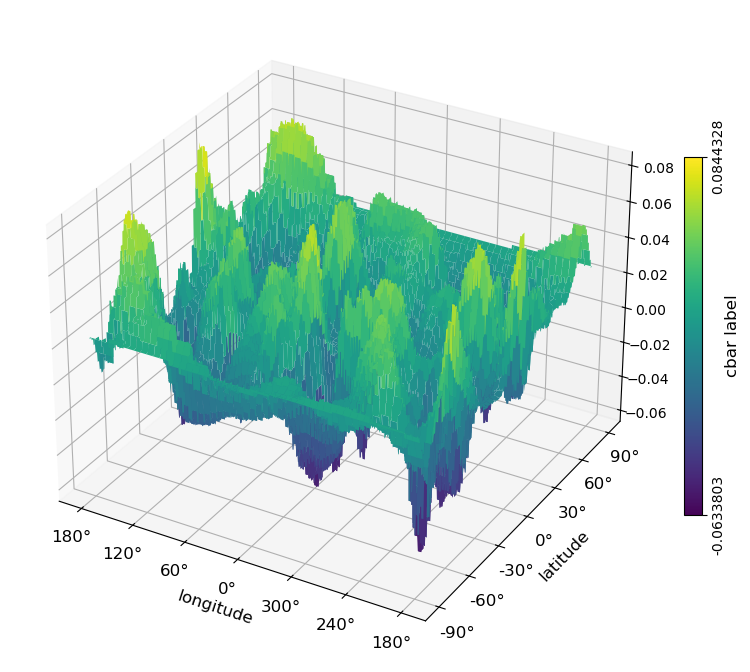
[18]:
# 3d view, vertical cbar
projview(
    m,
    coord=["G"],
    hold=False,
    graticule=True,
    graticule_labels=True,
    projection_type="3d",
    unit="cbar label",
    xlabel="longitude",
    ylabel="latitude",
    cb_orientation="vertical",
    cmap="viridis",
);
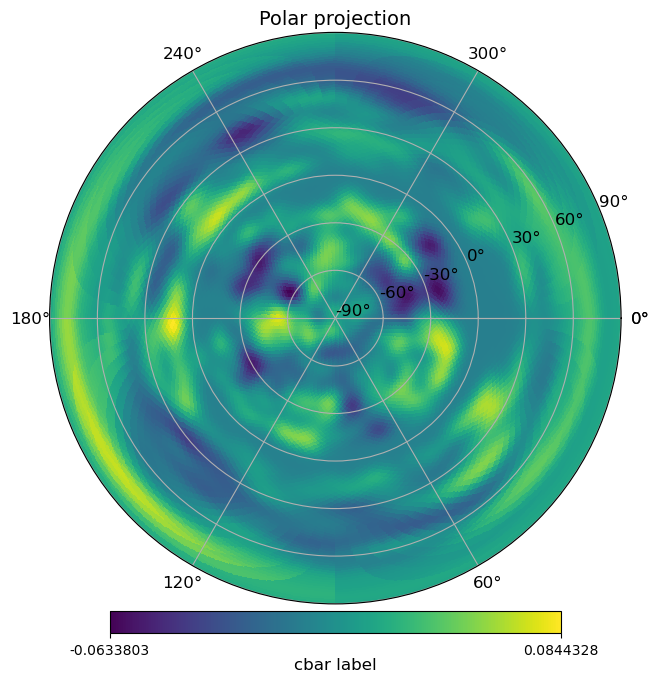
[19]:
# polar view
projview(
    m,
    coord=["G"],
    graticule=True,
    graticule_labels=True,
    unit="cbar label",
    cb_orientation="horizontal",
    projection_type="polar",
    title="Polar projection",
);
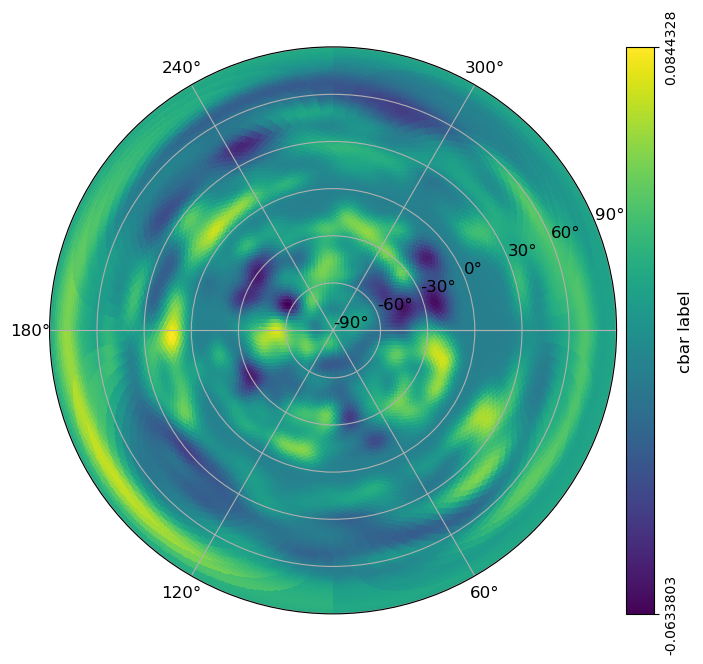
[20]:
# polar view, vertical cbar
projview(
    m,
    coord=["G"],
    graticule=True,
    graticule_labels=True,
    unit="cbar label",
    cb_orientation="vertical",
    projection_type="polar",
);
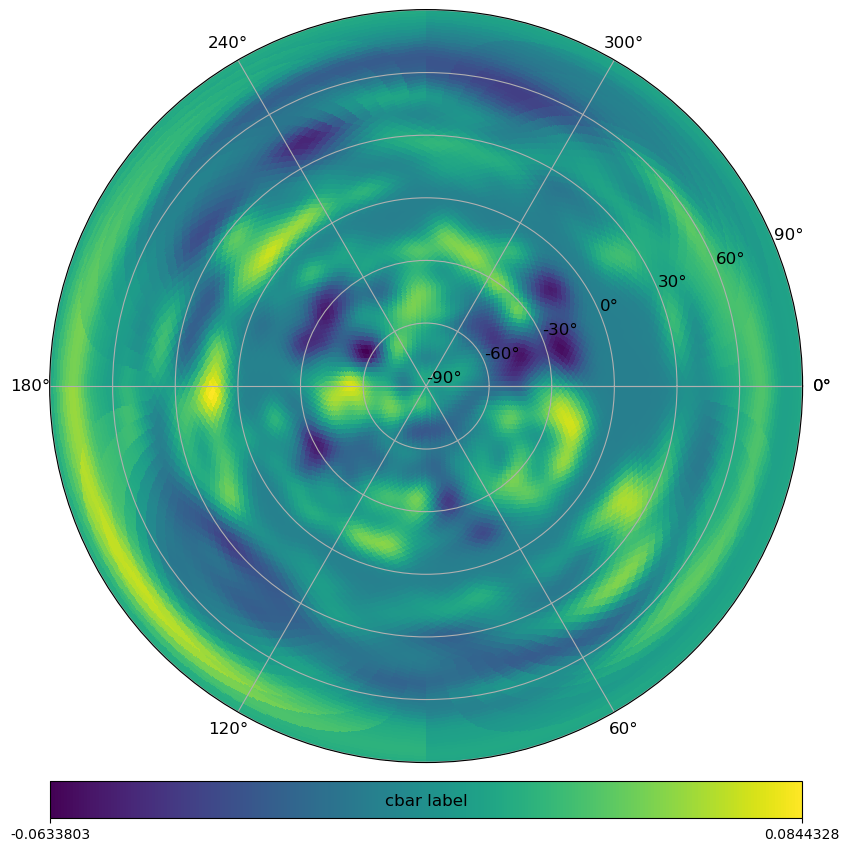
[21]:
# polar view, override example
projview(
    m,
    coord=["G"],
    hold=False,
    graticule=True,
    graticule_labels=True,
    flip="astro",
    projection_type="polar",
    unit="cbar label",
    cb_orientation="horizontal",
    override_plot_properties={
        "cbar_shrink": 0.5,
        "cbar_pad": 0.02,
        "cbar_label_pad": -35,
        "figure_width": 16,
        "figure_size_ratio": 0.63,
    },
);
/home/docs/checkouts/readthedocs.org/user_builds/healpy/envs/stable/lib/python3.12/site-packages/healpy/newvisufunc.py:493: UserWarning:
 *** Overriding default plot properies: {'cbar_shrink': 0.4, 'cbar_pad': 0.01, 'cbar_label_pad': 0, 'cbar_tick_direction': 'out', 'vertical_tick_rotation': 90, 'figure_width': 12, 'figure_size_ratio': 0.63} ***
  warnings.warn(
/home/docs/checkouts/readthedocs.org/user_builds/healpy/envs/stable/lib/python3.12/site-packages/healpy/newvisufunc.py:497: UserWarning:
 *** New plot properies: {'cbar_shrink': 0.5, 'cbar_pad': 0.02, 'cbar_label_pad': -35, 'cbar_tick_direction': 'out', 'vertical_tick_rotation': 90, 'figure_width': 16, 'figure_size_ratio': 0.63} ***
  warnings.warn("\n *** New plot properies: " + str(plot_properties) + " ***")
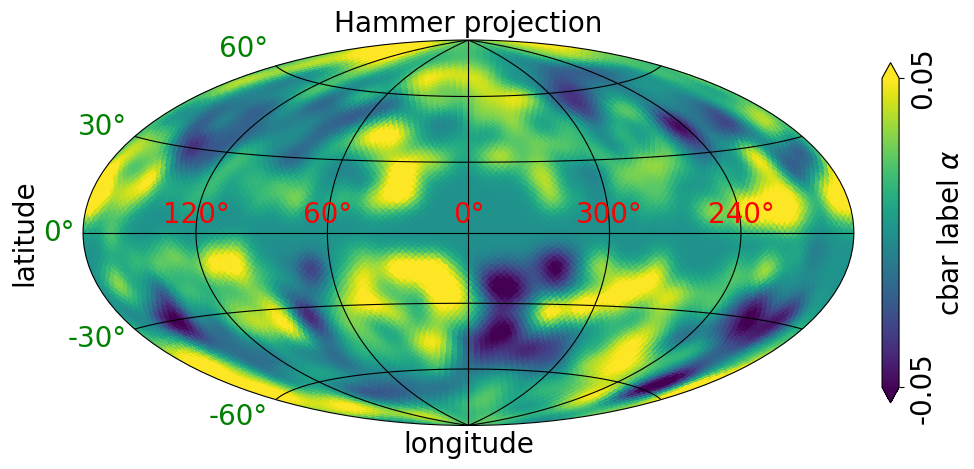
[22]:
# Hammer projection, changed fontsize example & LaTex font test
# and changed color of the axis ticks and graticule
projview(
    m,
    coord=["G"],
    graticule=True,
    graticule_labels=True,
    unit=r"cbar label $\alpha$",
    xlabel="longitude",
    ylabel="latitude",
    cb_orientation="vertical",
    min=-0.05,
    max=0.05,
    latitude_grid_spacing=30,
    projection_type="hammer",
    title="Hammer projection",
    fontsize={
        "xlabel": 20,
        "ylabel": 20,
        "xtick_label": 20,
        "ytick_label": 20,
        "title": 20,
        "cbar_label": 20,
        "cbar_tick_label": 20,
    },
    xtick_label_color="r",
    ytick_label_color="g",
    graticule_color="black",
);
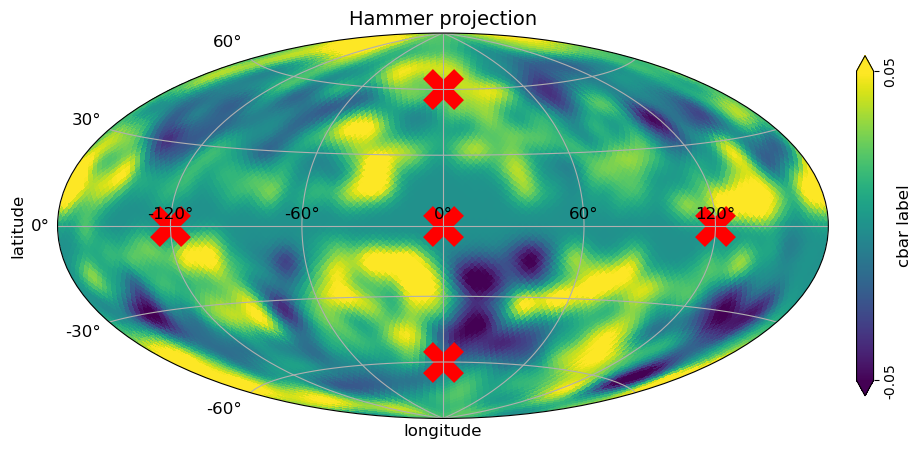
[23]:
# Hammer projection, no x-axis (phi or longitudinal);; no phi tick label shift
# This shows the true xtick labels
projview(
    m,
    coord=["G"],
    graticule=True,
    graticule_labels=True,
    unit=r"cbar label",
    xlabel="longitude",
    ylabel="latitude",
    cb_orientation="vertical",
    min=-0.05,
    max=0.05,
    latitude_grid_spacing=30,
    projection_type="hammer",
    title="Hammer projection",
    phi_convention="symmetrical",
);

# overlay the plot with another data
s = 500
plt.scatter(np.deg2rad(0), np.deg2rad(0), color="r", marker="x", linewidth=10, s=s);
plt.scatter(np.deg2rad(120), np.deg2rad(0), color="r", marker="x", linewidth=10, s=s);
plt.scatter(np.deg2rad(-120), np.deg2rad(0), color="r", marker="x", linewidth=10, s=s);
plt.scatter(np.deg2rad(0), np.deg2rad(60), color="r", marker="x", linewidth=10, s=s);
plt.scatter(np.deg2rad(0), np.deg2rad(-60), color="r", marker="x", linewidth=10, s=s);
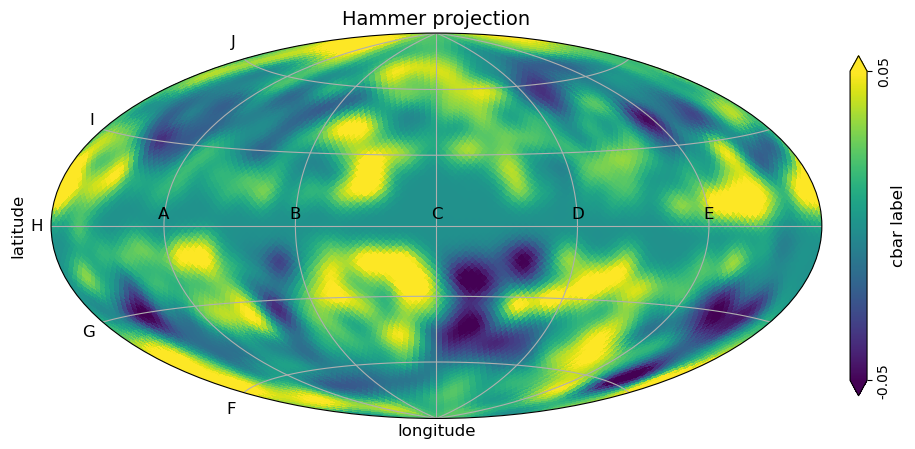
[24]:
# Hammer projection, override axis tick labels
projview(
    m,
    coord=["G"],
    graticule=True,
    graticule_labels=True,
    unit=r"cbar label",
    xlabel="longitude",
    ylabel="latitude",
    cb_orientation="vertical",
    min=-0.05,
    max=0.05,
    latitude_grid_spacing=30,
    projection_type="hammer",
    title="Hammer projection",
    custom_xtick_labels=["A", "B", "C", "D", "E"],
    custom_ytick_labels=["F", "G", "H", "I", "J"],
);
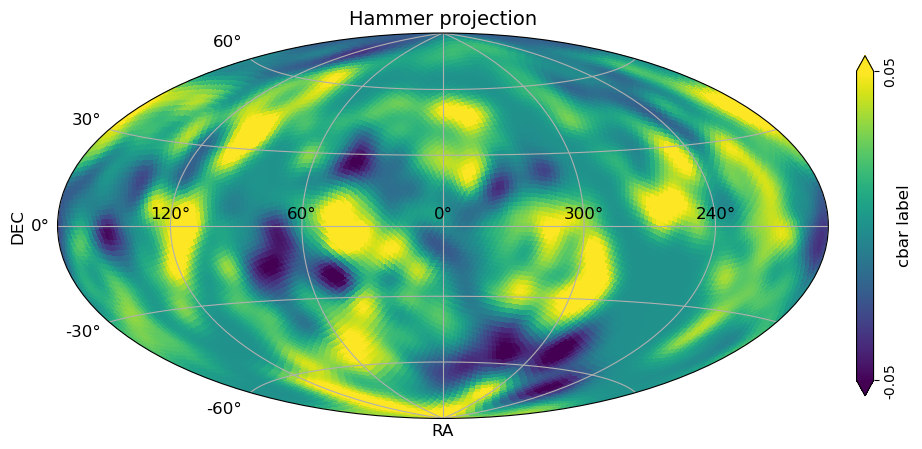
[25]:
# Hammer projection, Equatorial coordinates
projview(
    m,
    coord=["G", "C"],
    graticule=True,
    graticule_labels=True,
    unit=r"cbar label",
    xlabel="RA",
    ylabel="DEC",
    cb_orientation="vertical",
    min=-0.05,
    max=0.05,
    latitude_grid_spacing=30,
    projection_type="hammer",
    title="Hammer projection",
);
[26]:
# Cartesian projection in Local coordinates (transformed from Galaxy coordinates through Equatorial to local);
# (This is a Galaxy radio emission apex at Pierre Auger Observatory);
# azimuth convention with "phi_convention='counterclockwise'" is North:0, East:270, South:180, West:90
local_sidereal_time = 18
altitude = -35.206667
rotAngles = [(180 + (local_sidereal_time * 15)) % 360, -(altitude - 90)]

projview(
    m,
    coord=["G", "C"],
    graticule=True,
    graticule_labels=True,
    unit=r"cbar label",
    xlabel="azimuth",
    ylabel="zenith",
    cb_orientation="vertical",
    min=-0.05,
    max=0.05,
    latitude_grid_spacing=30,
    projection_type="cart",
    title="Cartesian projection",
    rot=rotAngles,
    fontsize={"xtick_label": 20},
    phi_convention="counterclockwise",
);

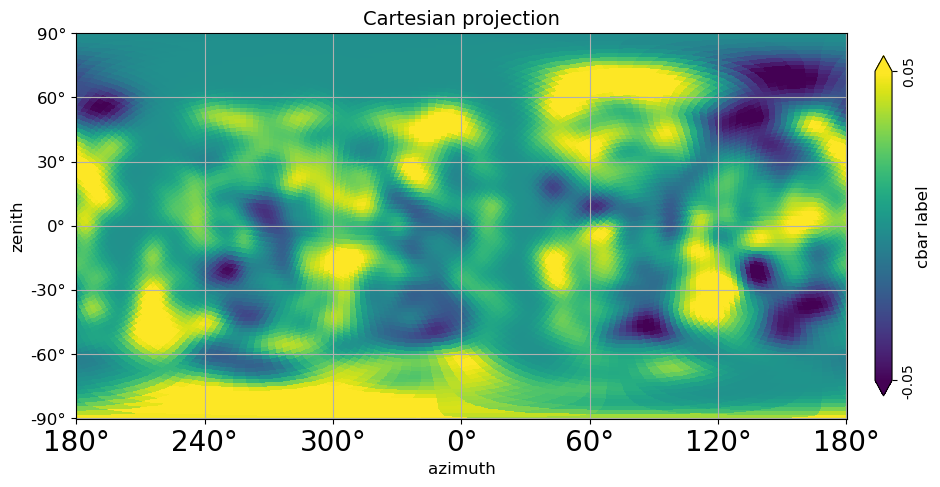
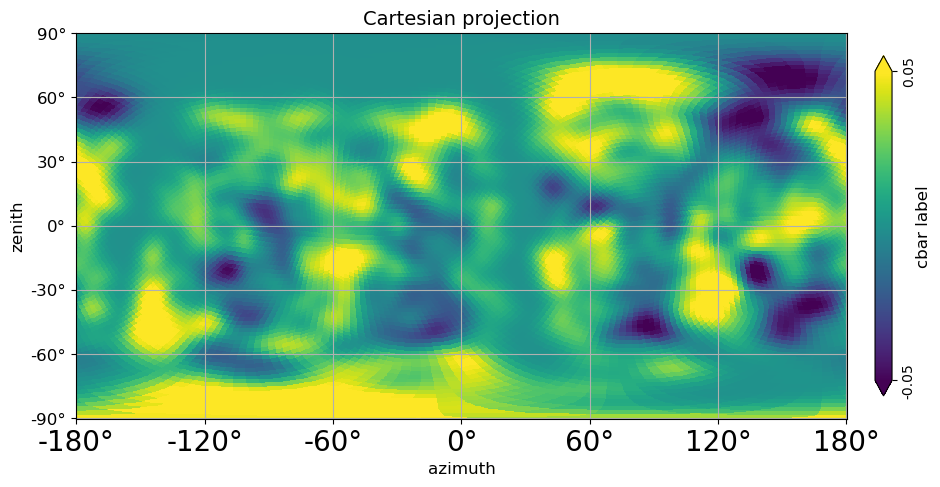
[27]:
# Cartesian projection in Local coordinates (transformed from Galaxy coordinates through Equatorial to local);
# (This is the Galaxy radio emission apex at Pierre Auger Observatory);
# azimuth convention with "phi_convention='clockwise'" is North:0, East:90, South:180, West:270

local_sidereal_time = 18
altitude = -35.206667
rotAngles = [(180 + (local_sidereal_time * 15)) % 360, -(altitude - 90)]

projview(
    m,
    coord=["G", "C"],
    graticule=True,
    graticule_labels=True,
    unit=r"cbar label",
    xlabel="azimuth",
    ylabel="zenith",
    cb_orientation="vertical",
    min=-0.05,
    max=0.05,
    latitude_grid_spacing=30,
    projection_type="cart",
    title="Cartesian projection",
    rot=rotAngles,
    fontsize={"xtick_label": 20},
    phi_convention="clockwise",
);
[28]:
# Cartesian projection in Local coordinates (transformed from Galaxy coordinates through Equatorial to local);
# (This is the Galaxy radio emission apex at Pierre Auger Observatory);
# azimuth convention with "phi_convention='symmetrical'" is North:0, East:90, South:180, West:-90

local_sidereal_time = 18
altitude = -35.206667
rotAngles = [(180 + (local_sidereal_time * 15)) % 360, -(altitude - 90)]

projview(
    m,
    coord=["G", "C"],
    graticule=True,
    graticule_labels=True,
    unit=r"cbar label",
    xlabel="azimuth",
    ylabel="zenith",
    cb_orientation="vertical",
    min=-0.05,
    max=0.05,
    latitude_grid_spacing=30,
    projection_type="cart",
    title="Cartesian projection",
    rot=rotAngles,
    fontsize={"xtick_label": 20},
    phi_convention="symmetrical",
)
plt.show()
[29]:
# return only data
# [longitude,  latitude, grid_map]
# longitude,  latitude are 1D arrays to convert them, to 2D arrays for the plot use np.meshgrid(longitude,  latitude);;
# longtitude goes from, -pi to pi (-180 to 180 in degs);
# latitude goes from, -pi/2 to pi/2 (-90 to 90 in degs);

longitude, latitude, grid_map = projview(m, coord=["G"], return_only_data=True)
print(longitude.shape)
print(latitude.shape)
print(grid_map.shape)
(1000,)
(500,)
(500, 1000)
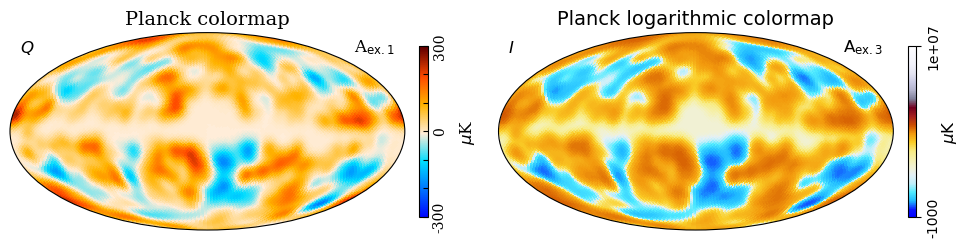
[30]:
# This example shows two Planck colormaps.
# The planck_log-colormap is used in combination with
# symlog2 for optimal viewing of frequency maps.
#
# Additional displayed features:
# Subfigures (Work the same way as mollview)
# Serif font
# Show tickmarkers
# tick direction keyword
# dipole/monopole subtraction

m_scaled = m*3000
projview(
    m_scaled,
    title="Planck colormap",
    cmap="planck",
    rlabel=r"A$_{\mathsf{ex. 1}}$",
    llabel=r"$Q$",
    unit=r"$\mu$K",
    fontname="serif",
    width=10,
    show_tickmarkers=True,
    cbar_ticks=[-300, 0, 300],
    cb_orientation="vertical",
    sub=121,
    override_plot_properties={"cbar_tick_direction": "in"},
);
projview(
    m_scaled,
    title="Planck logarithmic colormap",
    cmap="planck_log",
    norm="symlog2",
    rlabel=r"A$_{\mathrm{ex. 3}}$",
    llabel=r"$I$",
    unit=r"$\mu$K",
    min=-1e3,
    max=1e7,
    cb_orientation="vertical",
    sub=122,
);
plt.tight_layout();
/home/docs/checkouts/readthedocs.org/user_builds/healpy/envs/stable/lib/python3.12/site-packages/healpy/newvisufunc.py:493: UserWarning:
 *** Overriding default plot properies: {'cbar_shrink': 0.6, 'cbar_pad': 0.03, 'cbar_label_pad': 8, 'cbar_tick_direction': 'out', 'vertical_tick_rotation': 90, 'figure_width': 10, 'figure_size_ratio': 0.63} ***
  warnings.warn(
/home/docs/checkouts/readthedocs.org/user_builds/healpy/envs/stable/lib/python3.12/site-packages/healpy/newvisufunc.py:497: UserWarning:
 *** New plot properies: {'cbar_shrink': 0.6, 'cbar_pad': 0.03, 'cbar_label_pad': 8, 'cbar_tick_direction': 'in', 'vertical_tick_rotation': 90, 'figure_width': 10, 'figure_size_ratio': 0.63} ***
  warnings.warn("\n *** New plot properies: " + str(plot_properties) + " ***")
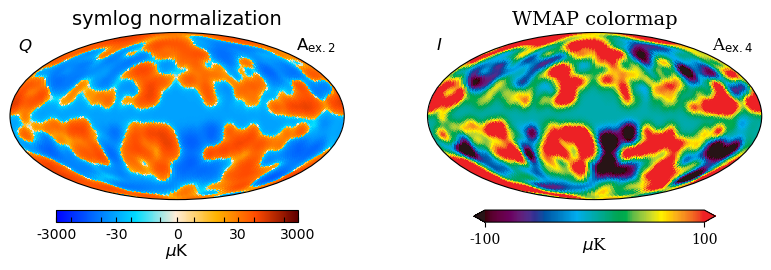
[31]:
# This code shows some of the features listed above,
# in addition to the WMAP colormap.
projview(
    m_scaled,
    title="symlog normalization",
    cmap="planck",
    norm="symlog",
    rlabel=r"A$_{\mathsf{ex. 2}}$",
    llabel=r"$Q$",
    unit=r"$\mu$K",
    cbar_ticks=[-3000, -30, 0, 30, 3000],
    remove_mono=True,
    show_tickmarkers=True,
    sub=121,
    override_plot_properties={"cbar_tick_direction": "in"},
    norm_dict={"linscale": 0.5},
);

projview(
    m_scaled,
    title="WMAP colormap",
    cmap="wmap",
    rlabel=r"A$_{\mathrm{ex. 4}}$",
    llabel=r"$I$",
    unit=r"$\mu$K",
    fontname="serif",
    min=-100,
    max=100,
    sub=122,
);
plt.tight_layout();
/home/docs/checkouts/readthedocs.org/user_builds/healpy/envs/stable/lib/python3.12/site-packages/healpy/newvisufunc.py:493: UserWarning:
 *** Overriding default plot properies: {'cbar_shrink': 0.6, 'cbar_pad': 0.05, 'cbar_label_pad': 0, 'cbar_tick_direction': 'out', 'vertical_tick_rotation': 90, 'figure_width': 8.5, 'figure_size_ratio': 0.63} ***
  warnings.warn(
/home/docs/checkouts/readthedocs.org/user_builds/healpy/envs/stable/lib/python3.12/site-packages/healpy/newvisufunc.py:497: UserWarning:
 *** New plot properies: {'cbar_shrink': 0.6, 'cbar_pad': 0.05, 'cbar_label_pad': 0, 'cbar_tick_direction': 'in', 'vertical_tick_rotation': 90, 'figure_width': 8.5, 'figure_size_ratio': 0.63} ***
  warnings.warn("\n *** New plot properies: " + str(plot_properties) + " ***")